Although Osmaniye is suitable for agricultural production, animal husbandry and forestry with its geographical location and natural structure, economic mobility has been observed in many industrial sectors in the province due to the widespread effect of industries expanding in the surrounding provinces and the spreading of incentive measures.
The economic structure of Osmaniye has improved based on agriculture. Due to its geographical location and climate structure being suitable for agriculture, agriculture was the leading sector of the economy. With the pressure of the expanding industry in the surrounding provinces and the Osmaniye province among the priority provinces in development, significant investments were made for various sectors with the incentives provided. The iron and steel industry has received a significant share from these investments. For this reason, the iron and steel industry has become an important sector in Osmaniye. The agriculture and food sector in some products has achieved the highest level of production in Turkey. Obtaining high value-added products from peanuts from agriculture-based sectors through product processing and product differentiation tends to develop in parallel with industrialization. The sectors that provide the dynamism that directs the economy of Osmaniye in general are food industry based on agriculture, iron and steel and stone, and industry based on soil
GDP PER PERSON IN THE PROVINCE BASE ($)
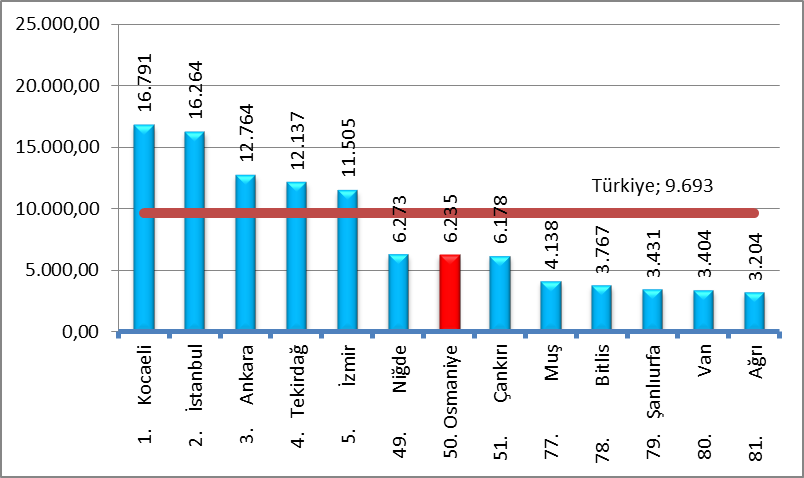
Source: TÜİK, 2018
Export Figures Of Turkey and Osmaniye (1000USD)
|
Year |
Osmaniye Export |
Rate of Change |
Turkey Export |
Rate of Change |
Share in Turkey |
|
2010 |
75.120,07 |
- |
113.883.219,18 |
- |
0,07% |
|
2011 |
131.537,38 |
75,10% |
134.906.868,83 |
18,46% |
0,10% |
|
2012 |
117.870,96 |
-10,39% |
152.461.736,55 |
13,01% |
0,08% |
|
2013 |
133.703,32 |
13,43% |
151.802.637,08 |
-0,43% |
0,09% |
|
2014 |
93.713,62 |
-29,91% |
157.610.157,69 |
3,83% |
0,06% |
|
2015 |
138.707,71 |
48,01% |
143.934.971,92 |
-8,68% |
0,10% |
|
2016 |
142.070,04 |
2,42% |
142.529.583,80 |
-0,98% |
0,10% |
|
2017 |
162.682,11 |
14,5% |
156.992.940,41 |
10,14% |
0,10% |
|
2018 |
271.846,44 |
67,1% |
168.023.390,68 |
7,03% |
0,16% |
|
2019 |
305.034,00 |
12,2% |
171.530.675,00 |
2,09% |
0,18% |
Source: TÜİK, 2019
Turkey's exports in 2019 increased by 2.09% compared to the previous year, while Osmaniye’s exports increased by 12.2% in 2019 compared to the previous year which performs above the average of Turkey increased rate as a province.
Compared to 2010, there has been a 306% increase in the exports of Osmaniye province. Osmaniye held a place of 48th in Turkey as a province exports in 2010 (75 million USD), while it took 31th place in 2019.
Import Figures Of Turkey and Osmaniye (1000USD)
|
Year |
Osmaniye Import |
Rate of Change |
Türkiye Import |
Rate of Change |
Share in Turkey |
|
2010 |
326.764,95 |
- |
185.544.331,85 |
- |
0,18% |
|
2011 |
836.774,17 |
156,08% |
240.841.676,27 |
29,80% |
0,35% |
|
2012 |
839.993,61 |
0,38% |
236.545.140,90 |
-1,78% |
0,36% |
|
2013 |
706.865,17 |
-15,85% |
251.661.250,11 |
6,39% |
0,28% |
|
2014 |
908.694,23 |
28,55% |
242.177.117,07 |
-3,77% |
0,38% |
|
2015 |
752.249,33 |
-17,22% |
207.234.358,61 |
-14,43% |
0,36% |
|
2016 |
600.859,02 |
-20,13% |
198.618.235,04 |
-4,16% |
0,30% |
|
2017 |
659.846,09 |
9,82% |
233.799.651,23 |
17,71% |
0,28% |
|
2018 |
739.287,23 |
12,04% |
223.039.038,05 |
-4,60% |
0,33% |
|
2019 |
583.373,00 |
-21,09% |
202.704.512,00 |
-10,03% |
0,29% |
Source: TÜİK, 2019
While Turkey imports in 2019 fell by 10.03% compared to the previous year, Osmaniye imports fell by 21.09%. However, Turkey imports increased by 9,25% in 2019 when evaluated according to year 2010 while Osmaniye import increased by 78.53%. Osmaniye took place at 22th at 2010 according to imports with 326,7 million USD. At 2019 with an import 583 million USD took place at 24th.
The Ten Countries With the Most Exports From Osmaniye (USD)
|
Rank |
Country |
2019 Export |
Share at 2019 |
|
1 |
Yemen |
79.438.518 |
26,04% |
|
2 |
Mısır |
46.125.693 |
15,12% |
|
3 |
Fas |
35.983.090 |
11,80% |
|
4 |
Kuzey Kıbrıs Türk Cum. |
18.148.507 |
5,95% |
|
5 |
Irak |
14.545.450 |
4,77% |
|
6 |
İsrail |
13.560.807 |
4,45% |
|
7 |
Cezayir |
10.362.415 |
3,40% |
|
8 |
İtalya |
9.635.942 |
3,16% |
|
9 |
Etiyopya |
9.626.169 |
3,16% |
|
10 |
Singapur |
9.267.757 |
3,04% |
Source: TÜİK, 2019
When the export pattern of Osmaniye province exports in 2019 is analyzed by countries, it is seen that geographical restrictions are insignificant and exports vary by country. While Yemen was the country to which Osmaniye was the most exported, with 79.4 million USD in 2019; Egypt is in second place.
The Ten Countries With the Most Imports To Osmaniye (USD)
|
Rank |
Country |
2019 Import |
Share at 2019 |
|
1 |
Hollanda |
129.706.835 |
22,23% |
|
2 |
Birleşik Krallık |
116.569.642 |
19,98% |
|
3 |
Belçika |
88.464.917 |
15,16% |
|
4 |
Libya |
44.595.741 |
7,64% |
|
5 |
ABD |
22.903.494 |
3,93% |
|
6 |
İsrail |
20.653.336 |
3,54% |
|
7 |
Rusya Federasyonu |
19.992.162 |
3,43% |
|
8 |
Brezilya |
15.304.366 |
2,62% |
|
9 |
Almanya |
12.263.849 |
2,10% |
|
10 |
Letonya |
11.432.352 |
1,96% |
Source: TÜİK, 2019
The geography of the countries where Osmaniye import was realized in 2019 also varied. 22.23% ($ 129 million) of the $ 583 million imports in 2019 were from the Netherlands, and 19.98% ($ 116 million) from the UK.
Ten Products The Most Exported By Osmaniye Province (USD)
|
Product |
2019 |
Share at 2019 |
|
Iron and Steel industry |
236.745.192 |
77,61% |
|
Yarn and woven textile from textile fiber |
32.966.692 |
10,81% |
|
Metal constrution materials |
7.756.731 |
2,54% |
|
Other general purpose machinery |
5.109.484 |
1,68% |
|
Metal goods not classified elsewhere |
4.845.363 |
1,59% |
|
Plastic products |
1.669.460 |
0,55% |
|
Fruits, crustaceans, beverage and spice plants |
1.227.292 |
0,40% |
|
Machines used in textile, clothing and leather processing |
1.183.390 |
0,39% |
|
Processed vegetables and fruits |
975.674 |
0,32% |
|
Lifting and carrying equipment |
950.456 |
0,31% |
Source: TÜİK, 2019
According to TÜİK figures in 2019, iron and steel sector provides 77% of the exports of approximately 305 million USD from Osmaniye. After the iron and steel industry, the highest export was made in textile products.
Osmaniye İlinin En Çok İthalatını Gerçekleştirdiği On Ürün (ABD Doları)
|
Product |
2019 |
Share at 2019 |
|
Waste and scrap |
443.871.283 |
76,09% |
|
Cereal and herbal products not classified elsewhere |
43.803.492 |
7,51% |
|
Electrical equipment not classifeid elsewhere |
21.902.746 |
3,75% |
|
Iron and steel main industry |
19.203.765 |
3,29% |
|
Main metal industry other than iron and steel |
19.125.178 |
3,28% |
|
Yarn and woven textile from fiber |
9.385.104 |
1,61% |
|
Chemical fertilizers and nitrogenous compounds |
7.974.268 |
1,37% |
|
Main chemical substances (Excluding chemical fertilizers and nitrogenous compounds) |
2.994.586 |
0,51% |
|
Machines used in textile, clothing and leather processing |
2.084.197 |
0,36% |
|
Cattle, sheep, goats, horses, donkeys, bardo, mules etc |
1.960.044 |
0,34% |
Source: TÜİK, 2019
According to figures in 2019, 76% of the imports worth approximately 583 million USD in Osmaniye province were largely in waste and scrap products used as inputs of the iron and steel industry.